End-to-end emissions management, from raw data to disclosure.
SEED ESG combines structured data collection, expert review workflows and AI-powered calculations — so your sustainability team spends less time chasing spreadsheets and more time driving decarbonisation.
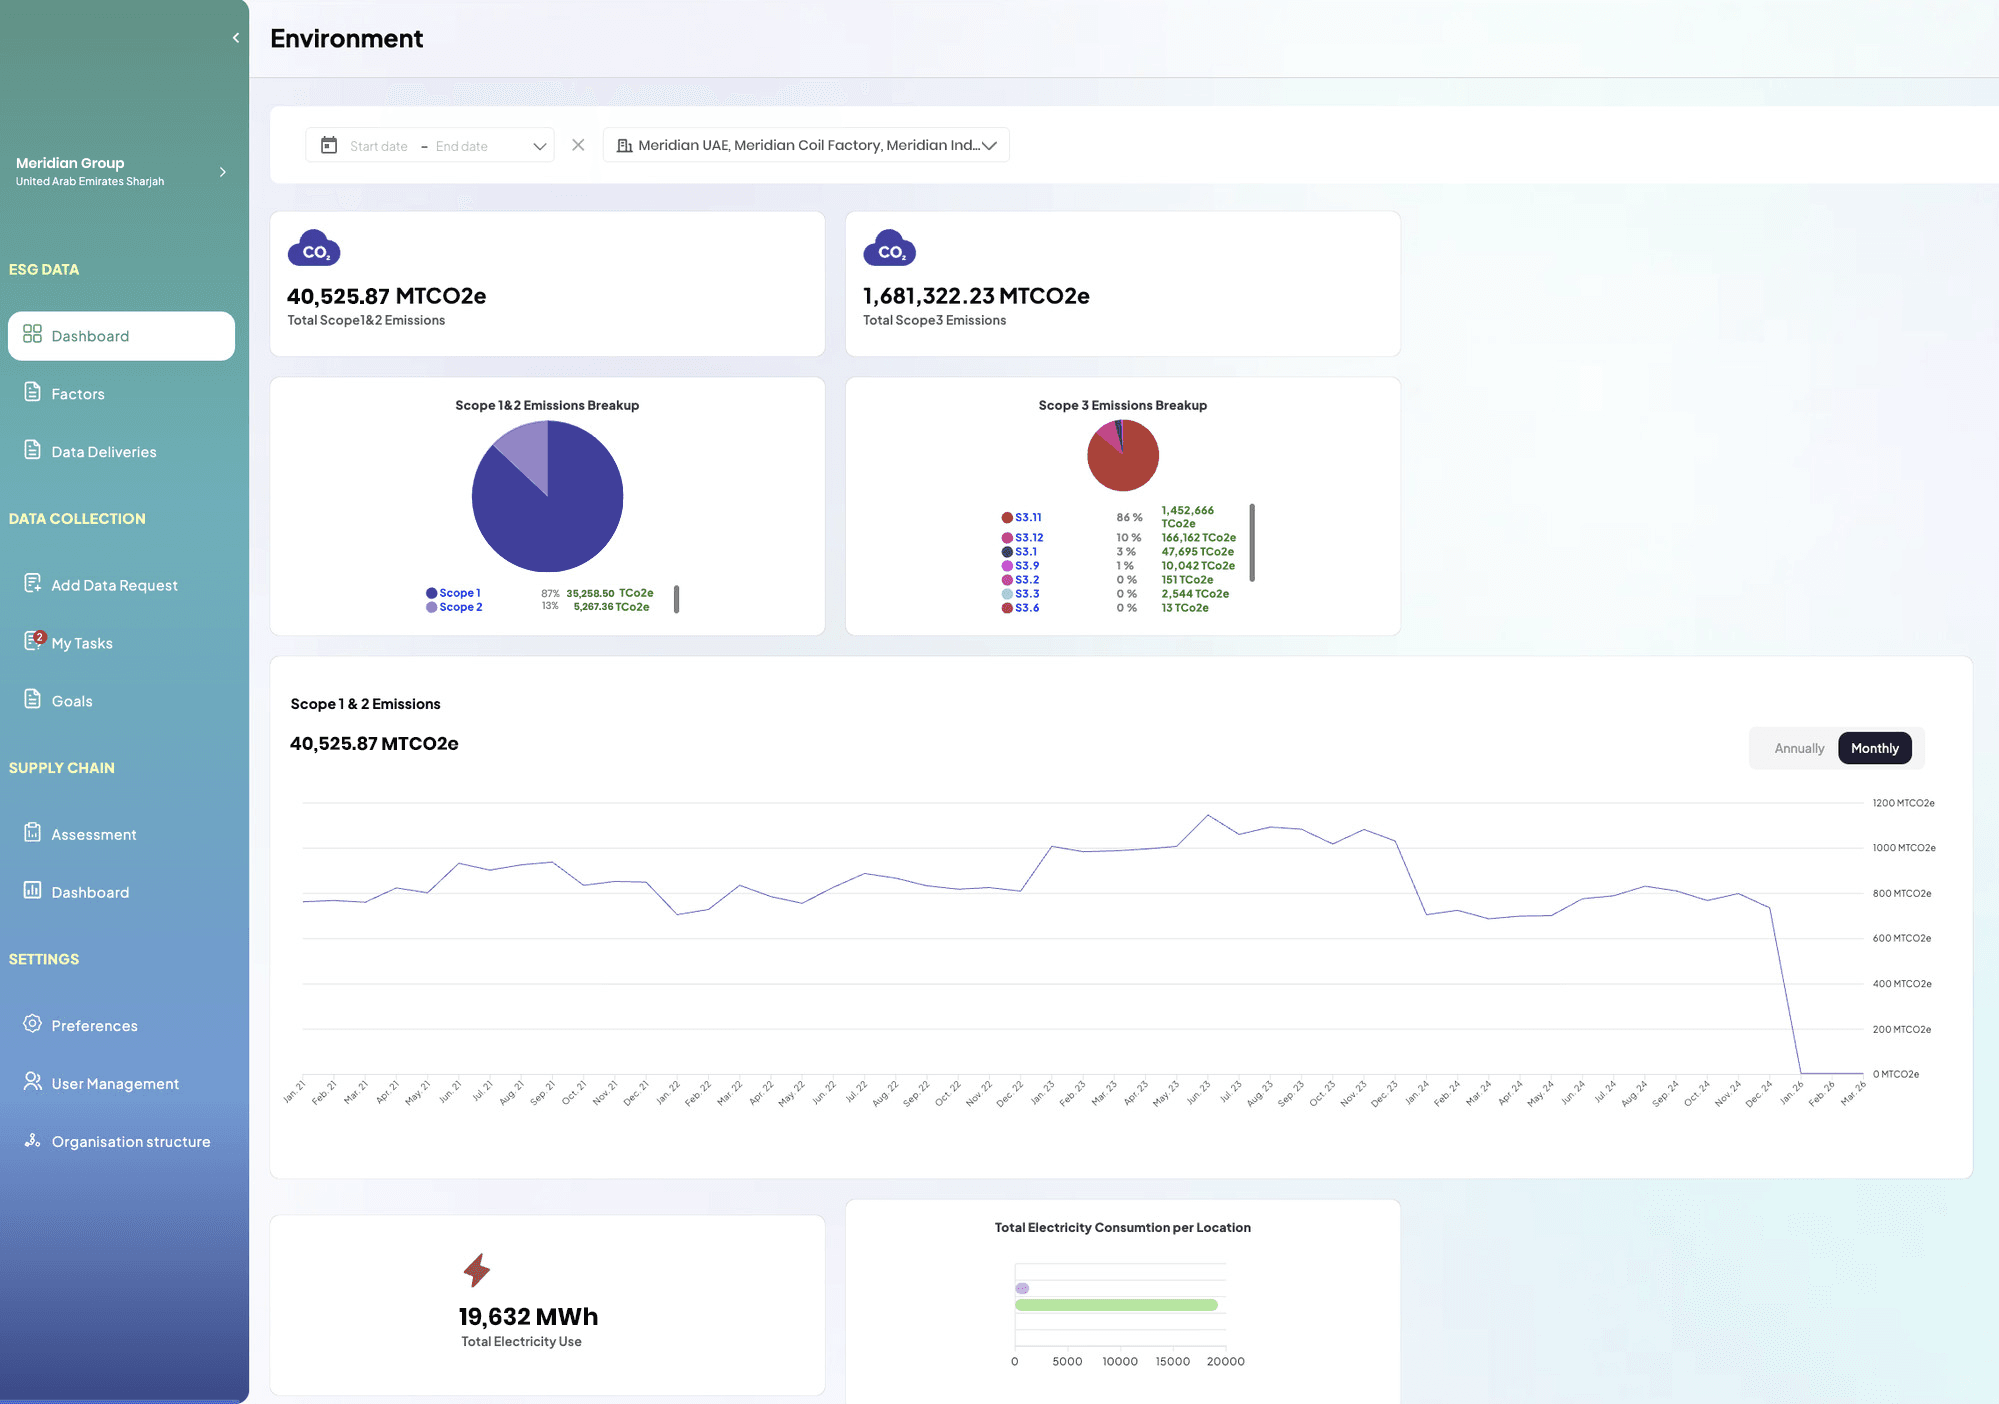
Live SEED ESG dashboard — Environmental view · Carbon, energy, water and waste at a glance
Scope 1, 2 and 3 — one schema.
Every scope handled with the same data model, the same review workflows, and the same audit trail.
Direct emissions
Track emissions from sources you own or control, with clean separation by site and asset.
- Fuel combustion (stationary & mobile)
- Company-owned vehicles
- On-site industrial and manufacturing processes
- Refrigerant and fugitive emissions
Indirect energy emissions
Measure emissions from purchased energy using both location-based and market-based methodologies.
- Electricity consumption
- Purchased heating and cooling
- Location-based and market-based calculations
- Residual mix and supplier-specific factors
Value chain emissions
Structured inputs and intelligent validation for the complexity of upstream and downstream emissions.
- Purchased goods and services
- Transportation and logistics
- Business travel and employee commuting
- Waste, water and end-of-life treatment
- Upstream and downstream value chain
From activity data to audit-ready disclosure.
A single, traceable pipeline from the moment a data owner submits a row, to the moment a regulator opens your report.
- 01
Data owners submit activity data
Standardized templates by department and site. Manual upload, scanning of bills/receipts, or fully automated API ingestion from ERP, CMS or HRMS.
- 02
Reviewers validate and route
Built-in workflows for review and approval. Every submission carries a complete audit trail of who submitted, who reviewed, and when.
- 03
AI applies emission factors
Once approved, the calculation engine applies the correct factors by activity, geography and reporting period. Factors are version-controlled.
- 04
Dashboards and disclosures
Real-time dashboards by scope, category and period. Export disclosure-ready data for GRI, SASB, TCFD, EU Taxonomy and more.
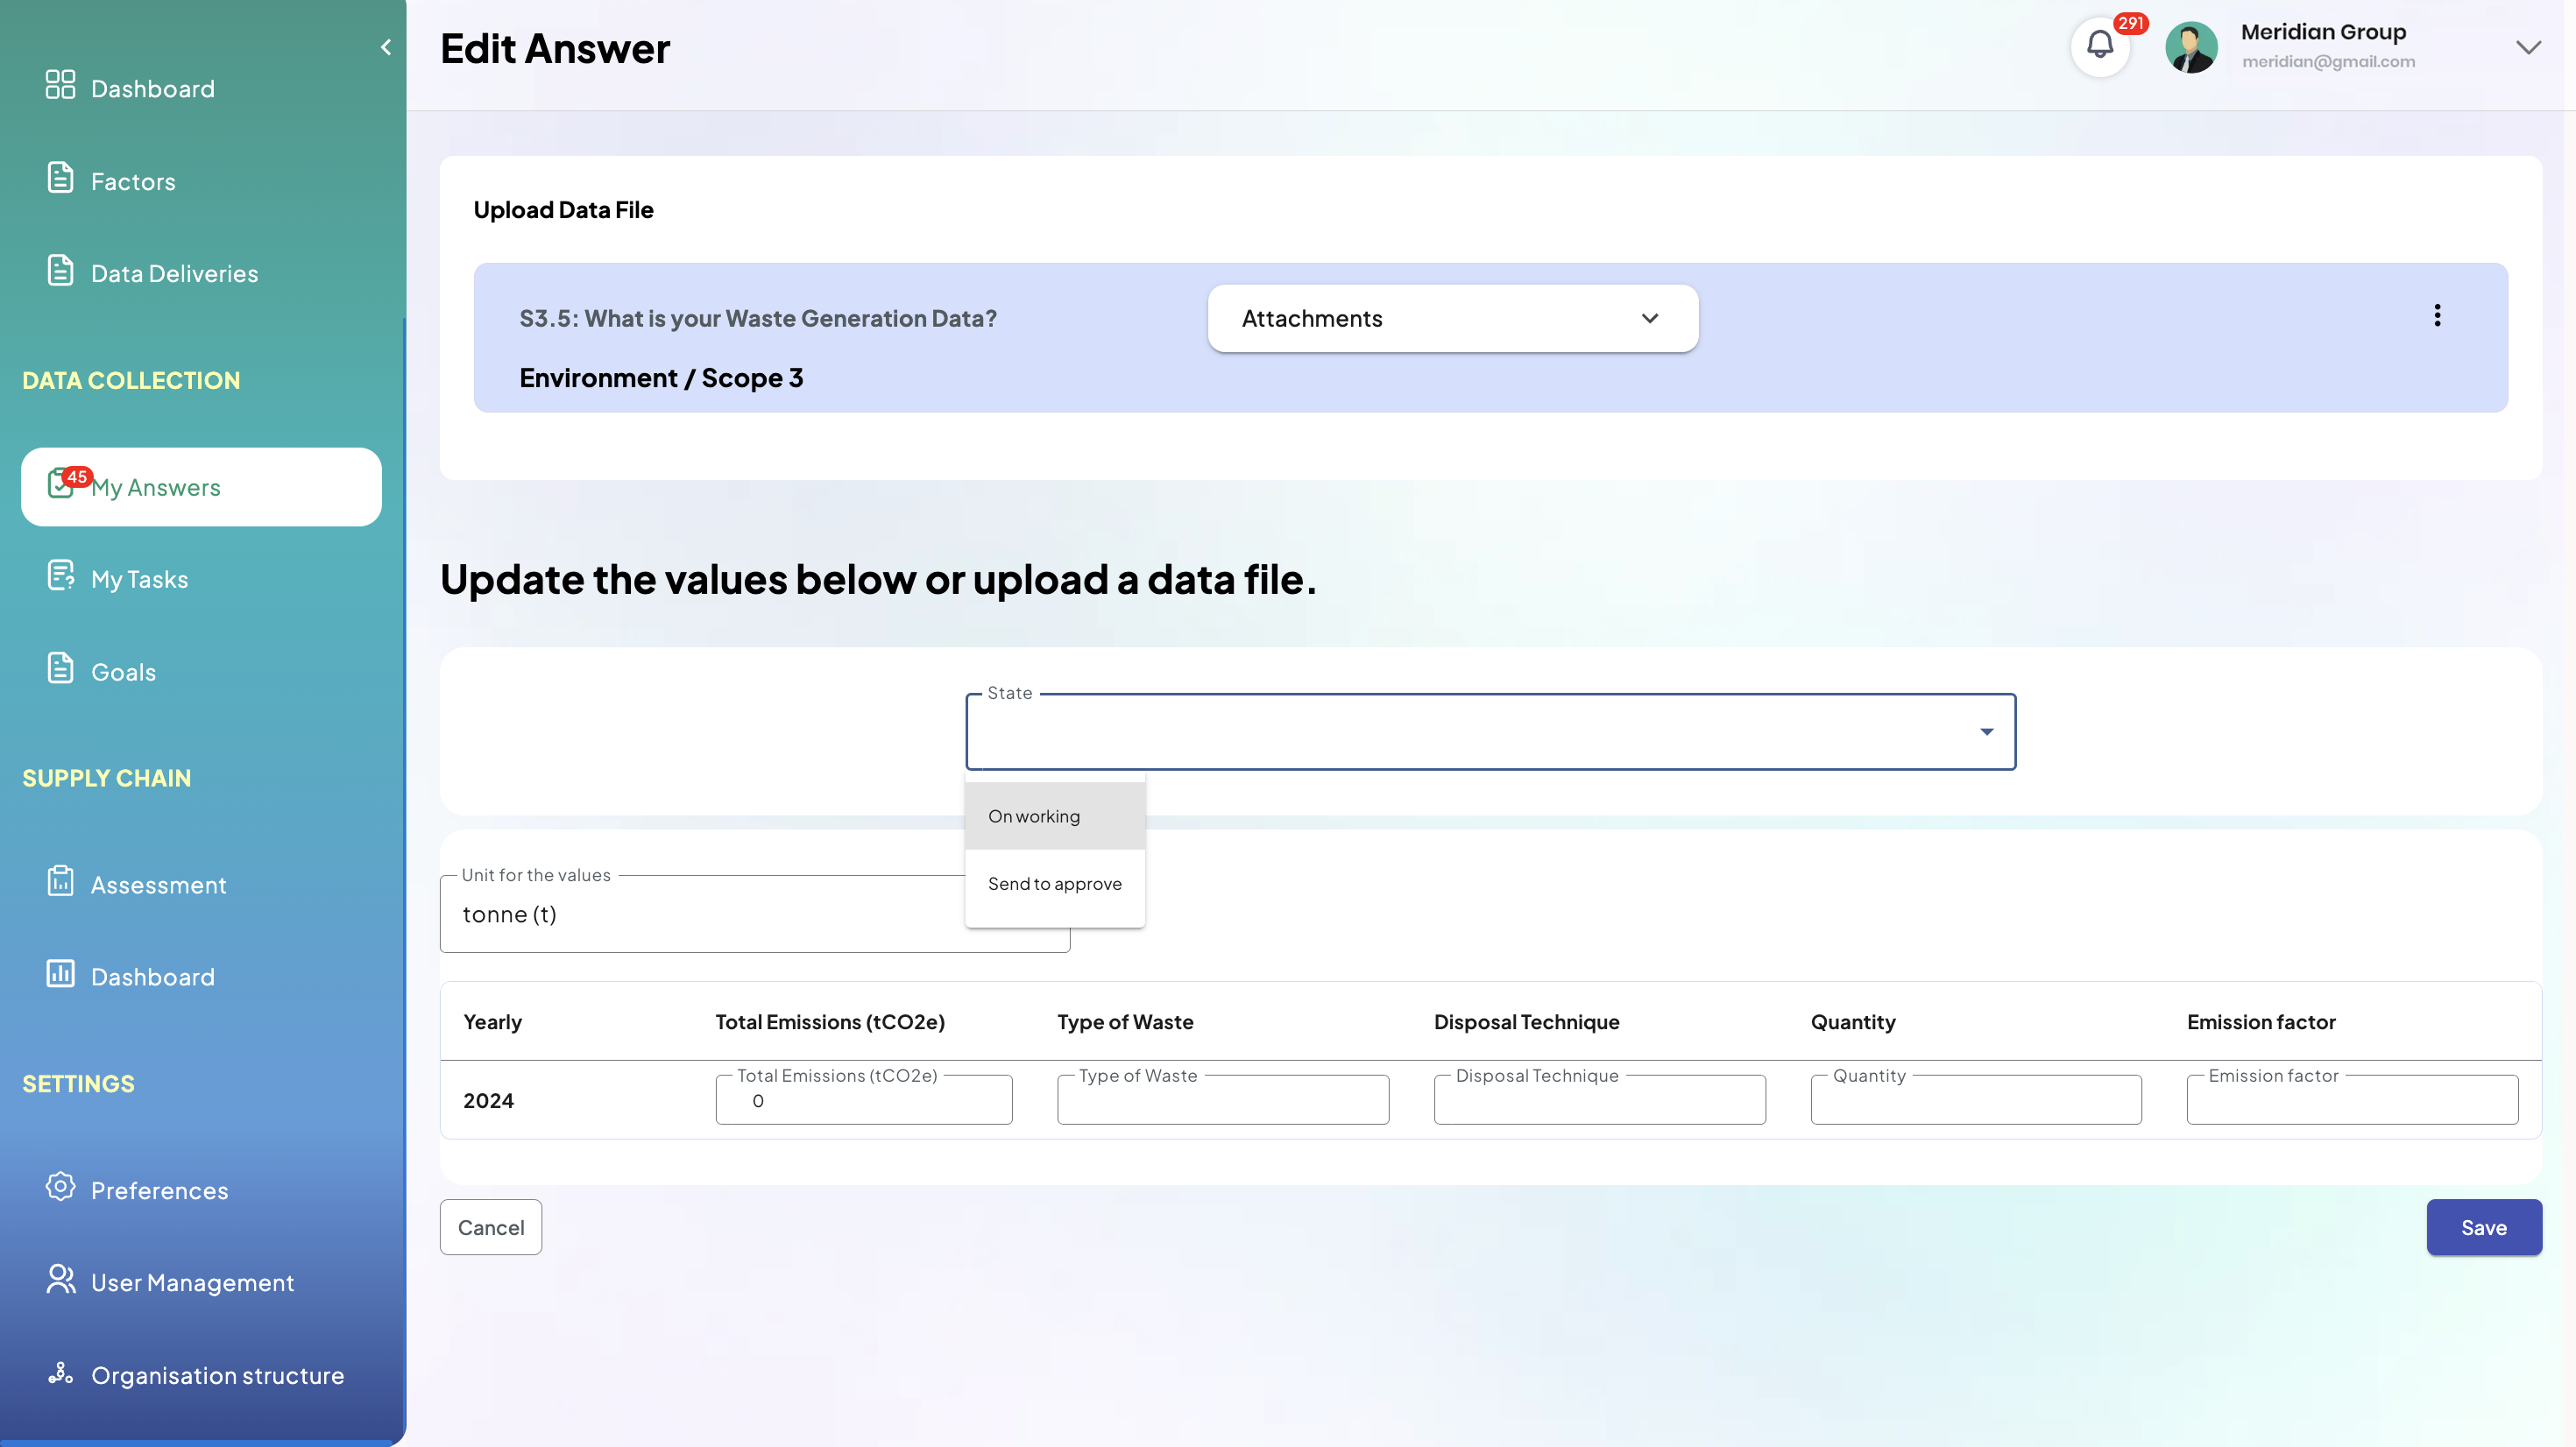
Data owners submit activity data with document attachments
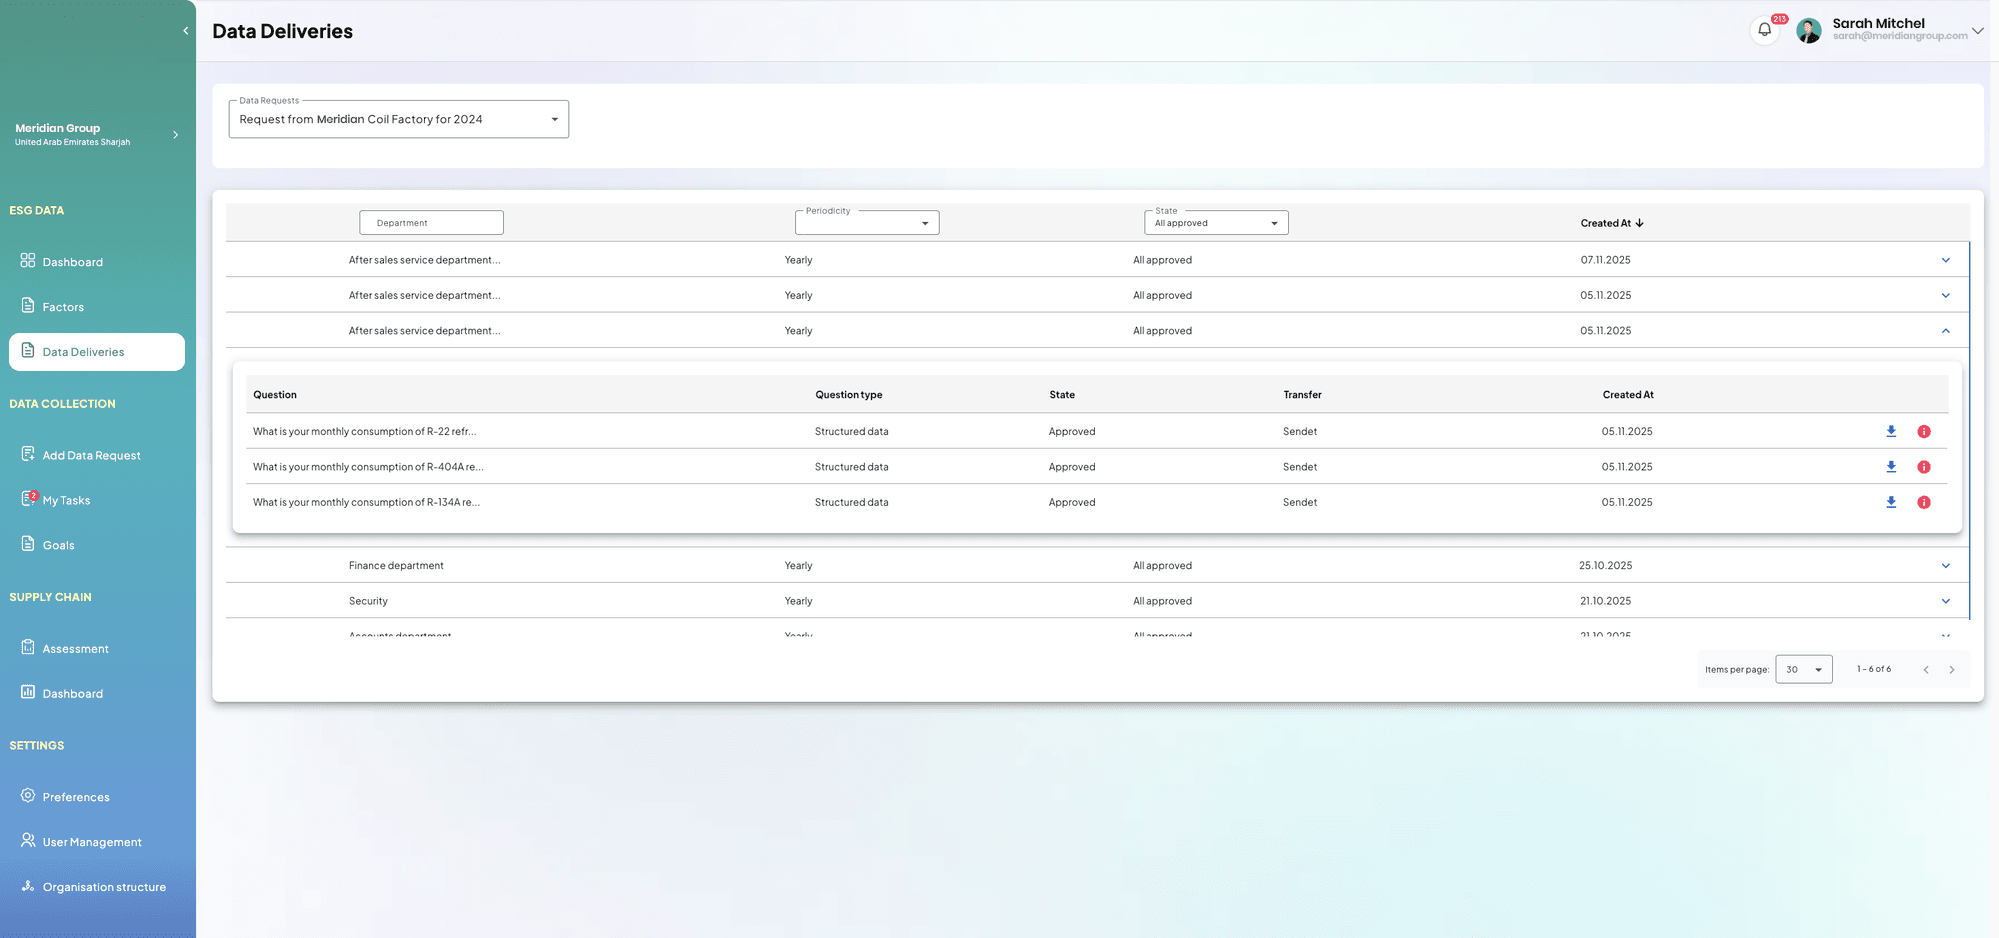
Reviewers approve submissions before they flow into calculations
Dynamic factors. Human oversight.
Traditional ESG tools force you to build and maintain a giant emission-factor library. SEED ESG flips the model: AI proposes the right factors, admins approve them, and calculations resume — automatically.
- Factors retrieved with AI and queued for approval
- Calculations pause for missing factors, then auto-resume
- Recalculate historical periods when factors update
- Every result is version-controlled and explainable
Plug into the data you already have.
Three integration modes, mix-and-match per data category — so you start where you are and automate over time.
Manual
Standardized templates by department, scope and site. Upload CSV or Excel, map columns to questions, and submit for review.
Semi-automated
Scan unstructured documents — utility bills, fuel receipts, travel statements — and let AI extract the right data points into the schema.
Fully automated
Connect ERP, CMS, HRMS or any operational system via API. Data flows in, gets validated, and routes to the right reviewer.
Insights you can act on and defend.
Real-time dashboards for the operating teams. Disclosure-ready exports for the regulators.
Net Zero & target tracking
Set science-based targets for Scope 1, 2 and 3 emissions. Track current vs. projected vs. targeted trajectories on an interactive chart — with filters by period, baseline year and reduction percentage.
- Scope-level goal setting aligned with SBTi and Net Zero
- Baseline year and target year configuration
- Real-time current vs. projected vs. targeted comparison
- Direct emissions, indirect emissions, and value chain
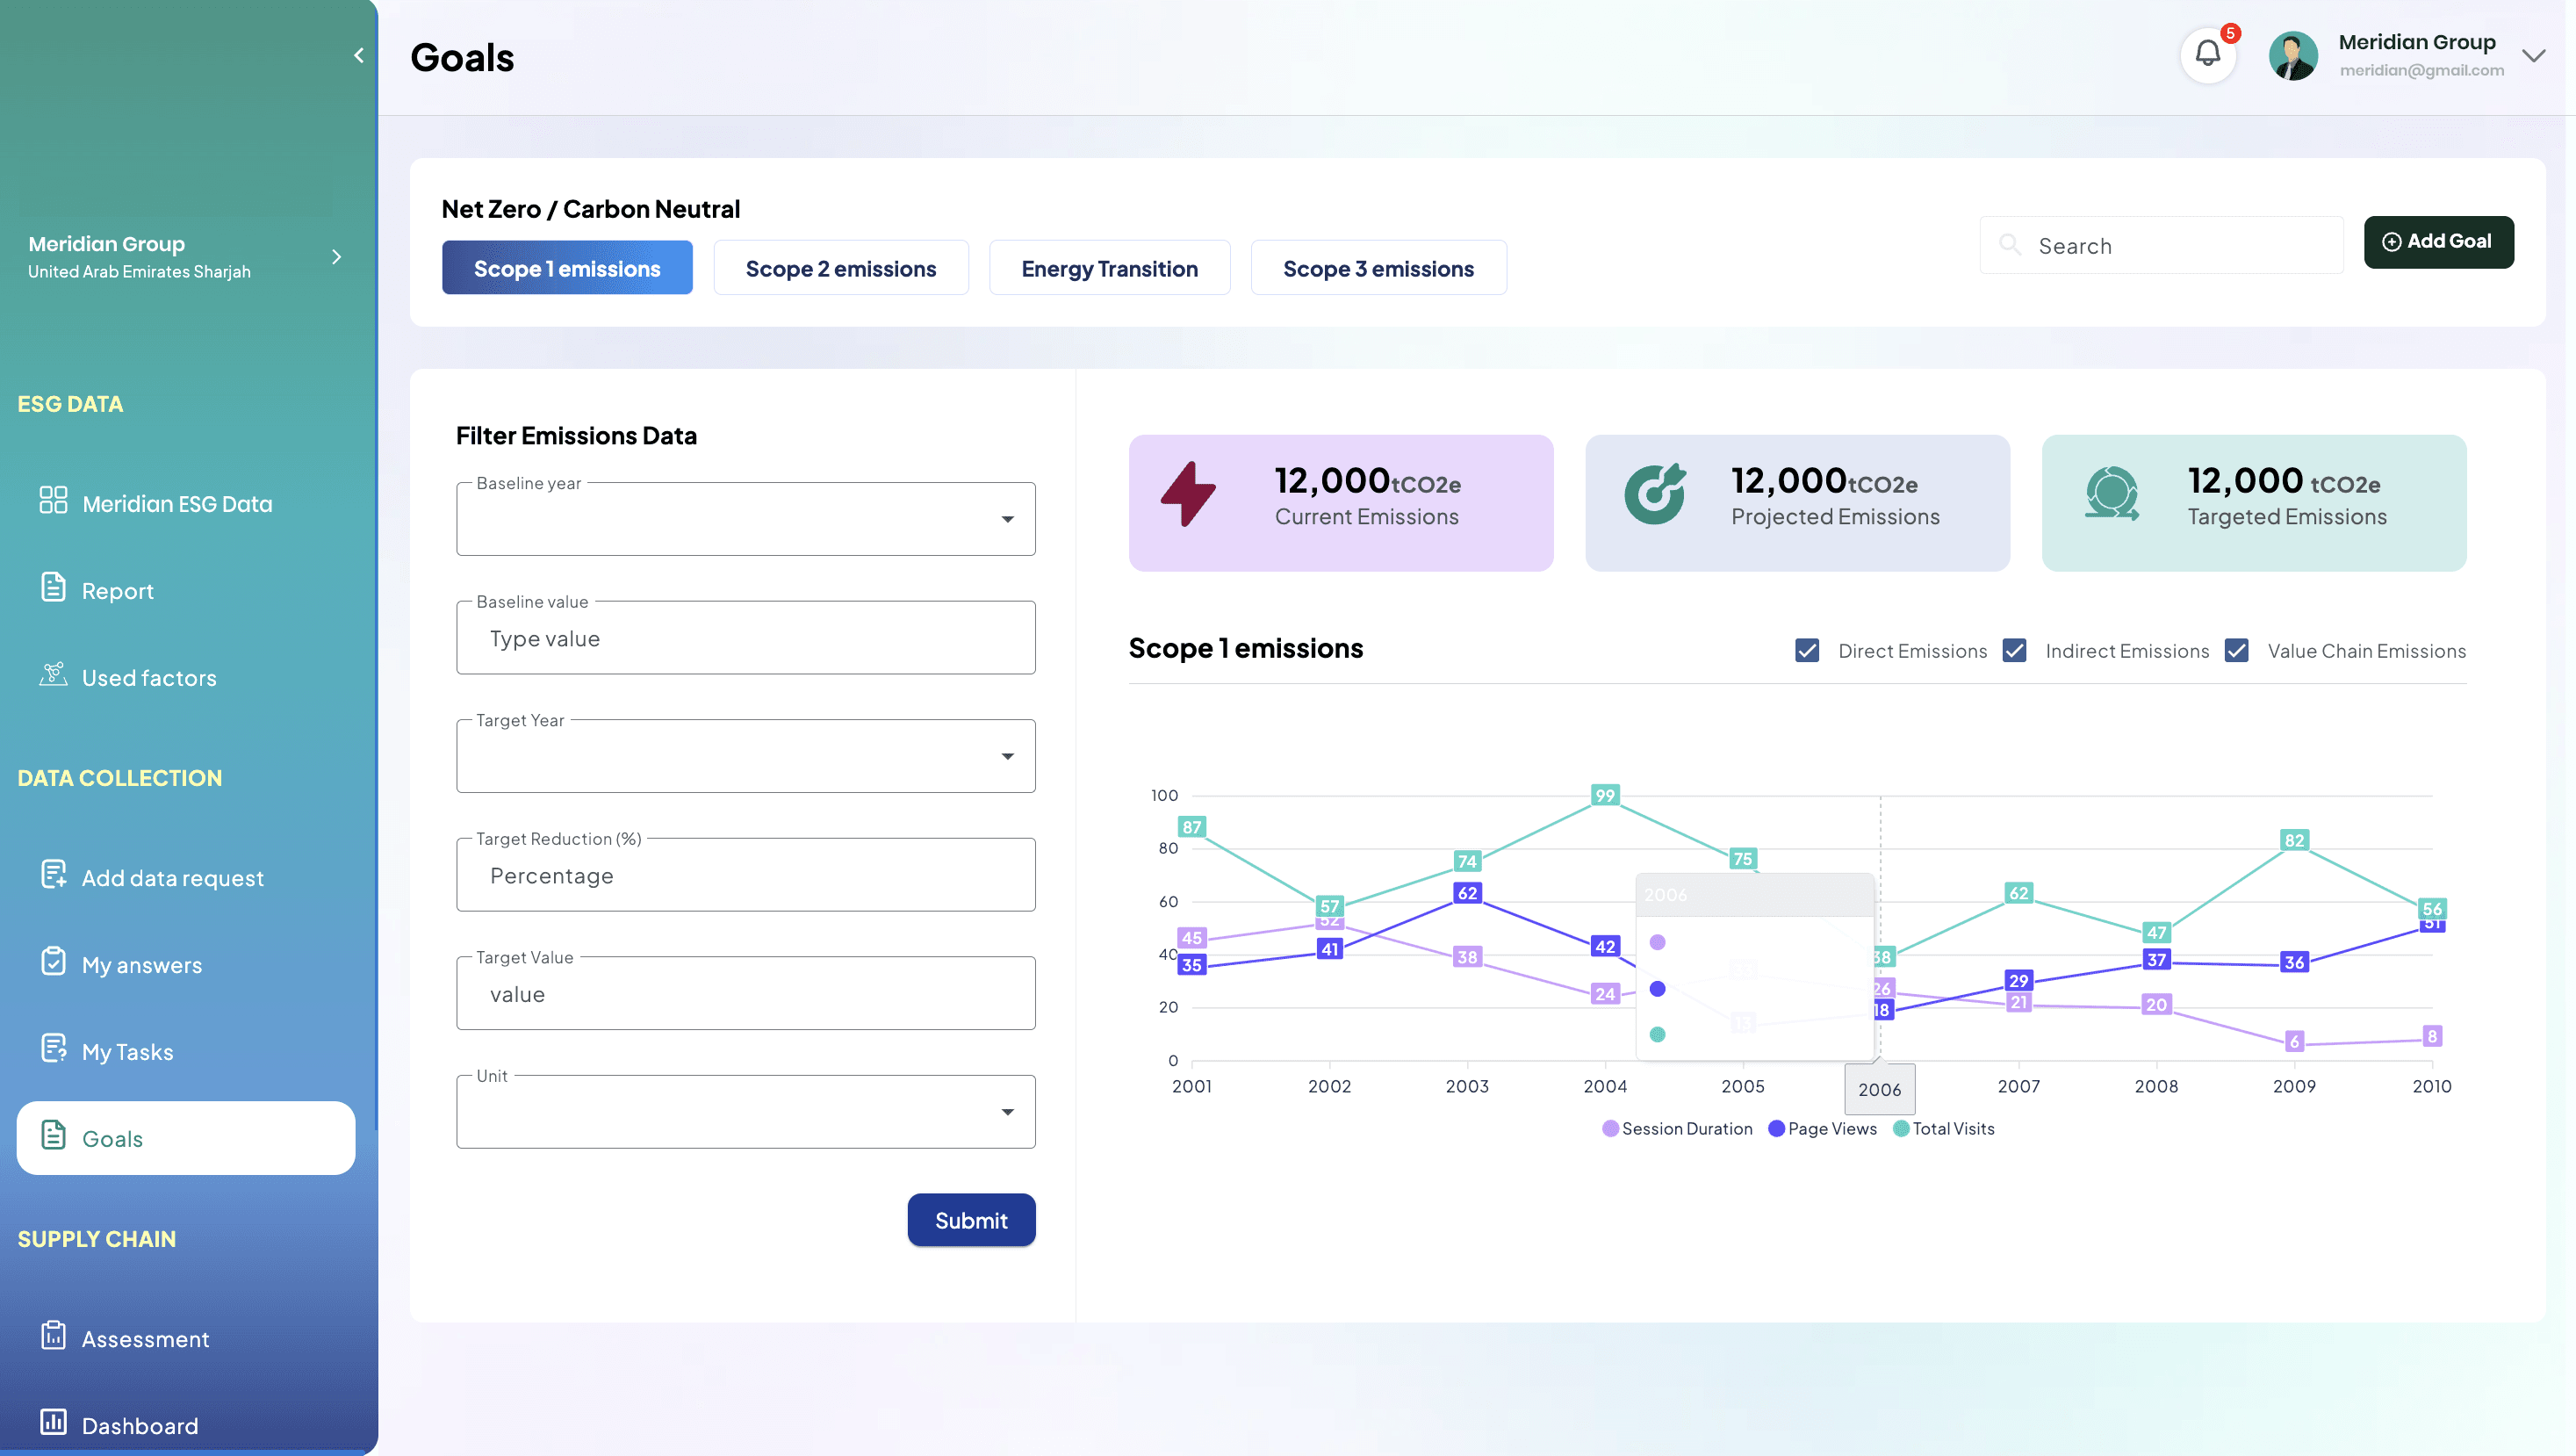
Real-time emissions overview
Scope 1, 2 and 3 totals with drill-downs by category, site and period.
Outlier and discrepancy flagging
Automatic alerts when activity data deviates from expected ranges or historical baselines.
Historical trends
Year-over-year and quarter-over-quarter comparisons across the whole organisation or any subset.
Custom dashboards
Configure views per business unit, region or board committee — no developer required.
Target tracking
Track progress against SBTi, Net Zero or internal KPIs from the same dashboard.
Disclosure-ready exports
GRI, SASB, TCFD, EU Taxonomy and impact reporting — exported with their lineage intact.
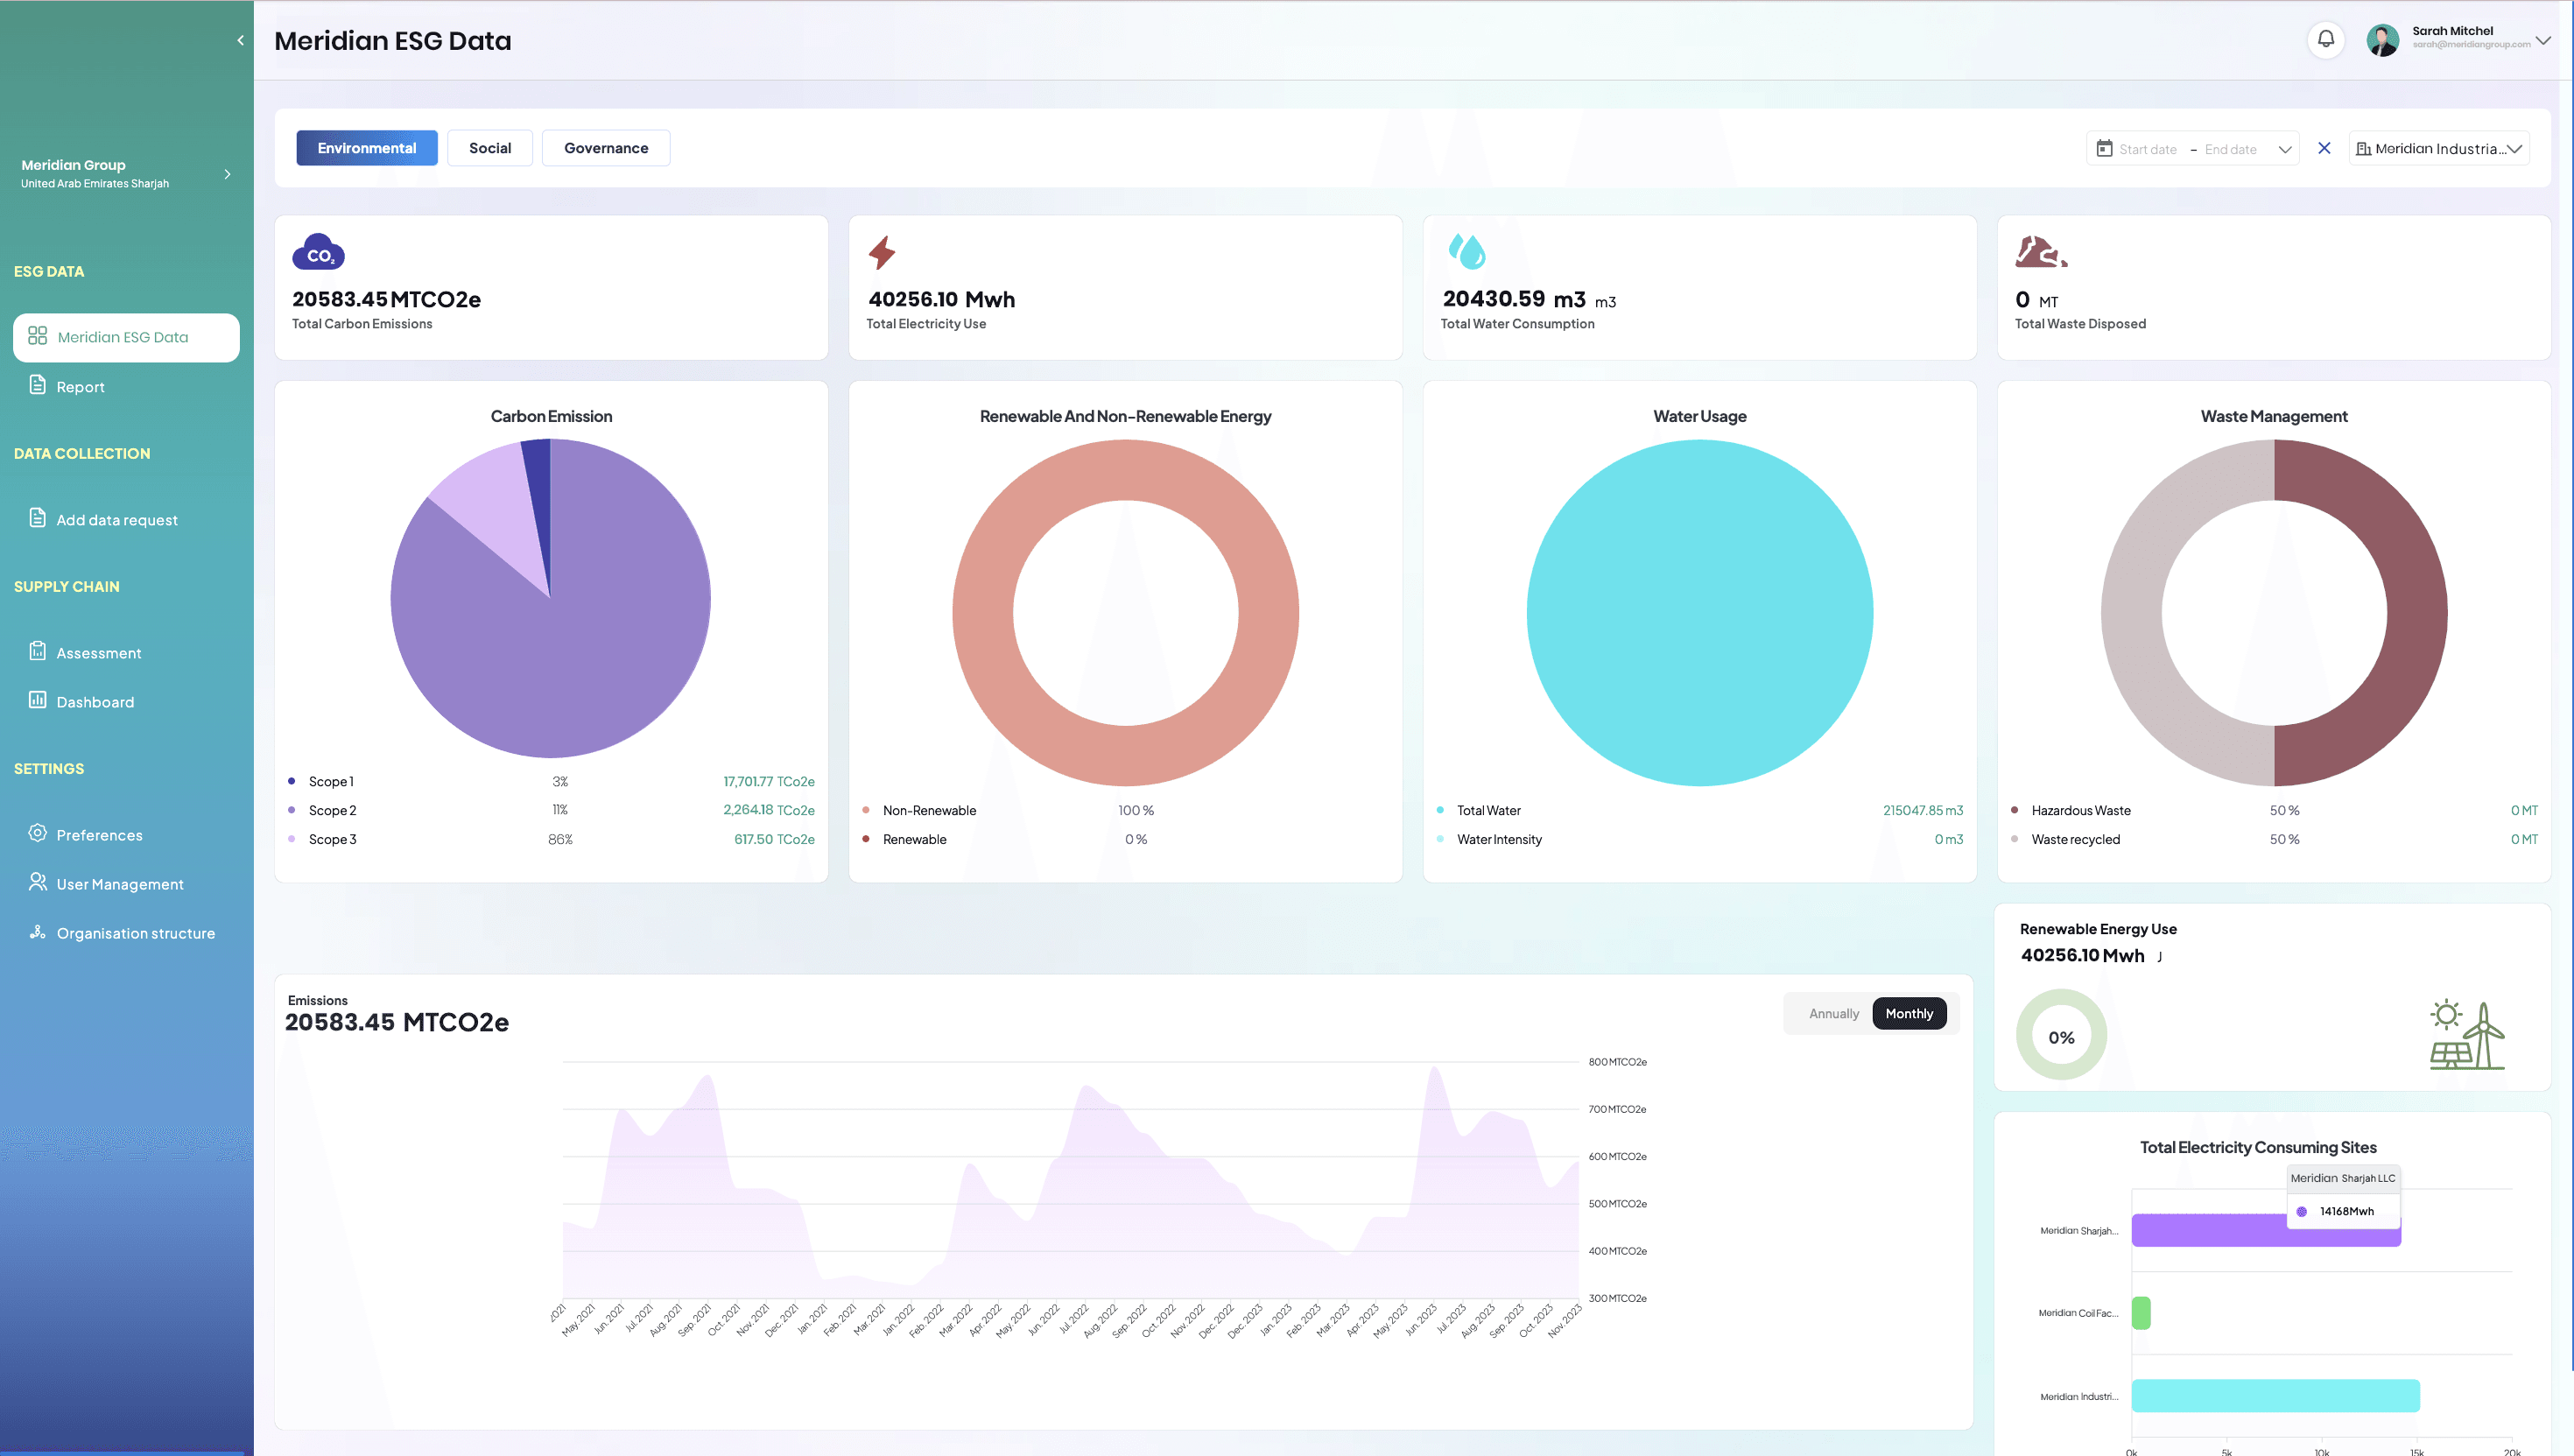
Real-time environmental overview — Scope 1, 2 and 3 with drill-downs by category and period
Enterprise-grade, by design.
Sustainability data is corporate data — and we treat it that way. SEED ESG is built on the same principles as the systems that hold your financials.
Dedicated, encrypted database per customer
Each tenant gets its own database with encrypted password protection — not a shared schema.
Obfuscated schema
Table names are obfuscated to add a meaningful layer of defence beyond standard access control.
No direct human access
No human path to stored data, minimising the risk of insider leaks.
Role-based access control
Distinct roles for Data Owner, Reviewer and Admin, each with appropriate scopes and permissions.
Full traceability
Every data submission, review, approval and calculation is logged and exportable.
UAE data residency
Databases located in the North UAE region for regional regulatory alignment.
See it on your data shape.
Tell us about your operating model and we'll demo the product configured for your industry, your scopes and your disclosure deadlines.